56TH ANNUAL CONFERENCE, Toronto, Canada, 15-19 May 2017WP No. 89Airframe Based Weather Reporting SystemsPresented by TOC |
Summary
As aviation weather technology gets more advanced, with products such as Aircraft Meteorological Data Relay (AMDAR), there is an increase in real time data. This data allows for more up to the minute forecasting and confirmations thereof. Some of the facets AMDAR contributes to are cloud ceilings, temperatures, and turbulence. Some airlines and ANSPs have been very collaborative but there are concerns over the future proprietary nature of the data.
Introduction
1.1 Traditionally weather reporting from the field has been done by a combination of human observation and fixed weather reporting sensors.
1.2 The Aircraft Meteorological Data Relay (AMDAR) observing system is on board equipment that allows for transmission of weather data for weather reporting and prediction. AMDAR has allowed for much more timely weather data to be received over a wider geographic area than before.
1.3 Recently AMDAR data has been dynamically received from aircraft, allowing controllers to make more moment-by-moment judgment calls with more precise real-time weather data. Pilots can see an advantage through more accurate filed weather avoidance routes as well as both turbulence and icing avoidance. Forecasters use the data for increased forecast accuracy and validation. Controllers and traffic managers see usefulness through routes that keep aircraft out of the adverse weather conditions as well as a potential reduction in frequency congestion due to better knowledge dispersal.
1.4 Controllers may only receive Pilot Reports (PIREPS) under certain circumstances such as low ceilings and the presence of turbulence. AMDAR provides reports over a wider spectrum of scenarios with even more information than traditionally received in a PIREP. These reports are ingested and sent all while keeping the frequency free for control instructions.
1.5 During critical phases of flight, when air crews are focused on flying, their aircraft the AMDAR system can still disseminate reports. These reports are critical for aerodrome and approach.
1.6 Whether there is a human or computer forecasting the weather it is vital to know the most accurate state of the atmosphere as a basis from which to start. The AMDAR program can provide 4 necessary pieces of information for the forecasting: air temperature, wind (direction and speed) air pressure and water vapour content.
1.7 One of the biggest future challenges is the proprietary nature of the data. If only some aviation professionals have access to AMDAR-data, there is potential for gaps in safety through lack of information.
Discussion
2.1. As AAS 1.16 states, in 2015 the paper titled “Future Aviation Weather Information and Distribution” recommended the new policies of:
| IFATCA encourages the development and use of aircraft-derived meteorological data to improve aviation weather products.
IFATCA encourages the development and distribution of graphical and easily human interpretable aviation weather products. IFATCA encourages the evolution of the aviation weather reporting and distribution system to allow direct access to aviation weather products for airspace users. |
2.2. This is further supplemented by ICAO document 7192, which governs weather for pilots and air traffic controllers. This section lists AMDAR amongst upper level weather and other frequently measured weather.
| 3.19.2 Required knowledge and skill
Upper-wind and upper-air temperature observations
Aircraft observations and reports (AIREPs)
Observations from MET satellites
|
History of AMDAR
2.3. Prior to AMDAR being developed, weather forecasting was heavily reliant on radiosondes and PIREPs for both forecasting and accuracy. Since the late 1930’s weather balloons and radiosondes have been utilized in forecasting. Today the radiosonde program still provides the greatest height of vertical information going up to altitudes of up to 35 km. Worldwide there are 800 weather reporting stations, most of which are in the Northern Hemisphere (https://www.ua.nws.noaa.gov/).
2.3.1. AMDAR was first proposed in 1970’s at Global Atmospheric Research Programme. Two incarnations were proposed; one utilizing geosynchronous satellites while the other used ACARS and VHF. The latter grew with great momentum toward the system used today, primarily due to ease of implementation (https://www.wmo.int/pages/prog/www/GOS/ABO/About_AMDAR.html). Starting in the 1980’s the Australian Bureau of Meteorology began collecting real time data from aircraft including air temperature and wind readings (https://www.eumetnet.eu/e-amdar). Meanwhile in the United States the National Oceanic and Atmospheric Administration (NOAA), began using aircraft observation in experimental numerical weather products (https://amdar.noaa.gov/).
2.3.2. By the 1990’s AMDAR had begun implementation with several European countries utilizing it on their national carriers. The Meteorological Office in the UK developed a program to process the data gathered by British Airways. This led to an opportunity to utilize a single processing system for all of the participating European carriers (https://eumetnet.eu/activities/observations-programme/current-activities/e-amdar/). Meanwhile in the United States starting in 1996 airlines began to allow direct access of the data to NOAA meteorologists (https://amdar.noaa.gov/docs/bams/). By 1998 a global consortium came together to form a panel at the World Meteorological Organization (WMO) on AMDAR to establish operating procedures, memberships and goals. One of the fundamental goals of the panel was to ensure a free and open international sharing of data (https://www.wmo.int/pages/prog/www/GOS/ABO/AMDAR/panel/AMDAR_Panel.html).
2.3.3. Today there are more than 10 different national and regional AMDAR groups. AMDAR offers an opportunity to collaborate on many national levels. The sharing of the data allows for a more comprehensive worldwide picture. There is also the possibility of sharing some infrastructure such as ground based processing of the AMDAR data.
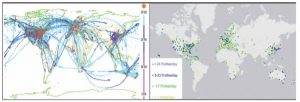
2.3.4. Above left is a diagram showing the distribution of readings over a 24-hour period from January 2014. On the right is a graphic showing average daily take offs and landings during the same time frame. The colour codes denote the frequency of the reports (https://journals.ametsoc.org/doi/pdf/10.1175/BAMS-D-14-00055.1).
What is AMDAR?
2.4. AMDAR makes use of the existing on board sensors and computers coupled with the communication system to collect and process the meteorological data to either the ground or through data link. According to the WMO the essential equipment is: the on-board AMDAR system, air to ground and ground to ground communications systems, ground based data processing systems and a ground based data optimisation system (https://www.wmo.int/pages/prog/www/GOS/ABO/AMDAR/AMDAR_System.html).
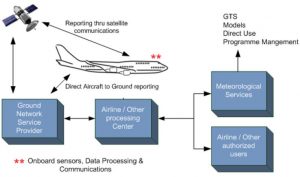
2.4.1. Combining the data received by existing equipment combined with AMDAR exponentially increases the depth of the weather data. AMDAR data is a high quality and relatively low cost method of getting much more timely weather data. As more aircraft equipped with AMDAR are further equipped with water vapour sensors the data will become even more valuable. Though some of the same data can be received from the radiosonde program the frequency and geographic spread of AMDAR is far superior, especially in areas where a radiosonde program had not previously reliably existed (https://www.wmo.int/pages/prog/www/GOS/ABO/AMDAR/publications/Requirements_Implementation_Operation_AMDAR_Programme.pdf).
2.4.2. AMDAR is used to forecast such phenomena as precipitation, convection, cloud coverage and height, low level wind shear potential, surface temperature and dew points, cold air damming, wild fire potential and fog. It is also used to compare of numerical weather data to observed data.
2.4.3. According to the National Transportation Safety Bureau (NTSB) (US), AMDAR is at the core of airframe based reporting systems comprising up to 95% of reports received. The remaining 5% come from a combination of PIREPs, AIREPs, and other sources. The data is also critical in several forecasting models such as what the NTSB deems the backbone of aviation guidance forecasting: the High Resolution Rapid Refresh (HRRR) (https://www.ntsb.gov/news/events/Documents/2016_pirep_FRM_3_Panel_4_Pritchett.pdf).
2.4.4. The WMO states that AMDAR data was shown to be the 3rd most important data set when it comes to reducing global Numerical Weather Prediction (NWP) model error and further forecast improvement. Also, AMDAR is attributed as a primary contributor in wind forecast error reduction of 50% at cruise level while having the greatest accuracy increase in the 3-48 hour forecasts (https://library.wmo.int/opac/doc_num.php?explnum_id=3087).
2.4.5. Gathering many overlapping pieces of data gives us a mosaic of information, providing a more comprehensive picture and more reliability. There are parameters for when and where measurements are gathered for optimised results. In E-AMDAR, European AMDAR, the information can be targeted for specific National Meteorological and Hydrological Services (NMHS) users such as forecasters or researchers.
How Does AMDAR Work?
2.5. The NTSB reports that there are over 650,000 reports received daily from over 3,000 participating aircraft. There are over 38 airlines participating in the program. The raw AMDAR data is most useful once compiled into a more easily utilized set of data, which can be done through various types of software. Pilots may see the data in terms of turbulence forecast maps. Forecasters may utilize the data in the creation of weather forecasts. Controllers see the products of the data by way of the forecasters sharing the forecasts of their findings (https://www.ntsb.gov/news/events/Documents/2016_pirep_FRM_3_Panel_4_Pritchett.pdf).
2.5.1. The automated weather reporting sensors (at many US airports) report at different intervals depending on the weather reporting system used – AWOS or ASOS. AWOS reports every 20 minutes because it does not send out special reports, whereas ASOS sends out reports hourly unless there is a major change, when it would send out a special report. This could mean that an airport is using less accurate data. Using the data that an aircraft system gathers in flight allows for a timelier adjustment of en route weather and aerodrome reports (https://belfortinstrument.com/products/automated-weather-observation-system-awos/).
2.5.2. The better-quality information that is received from AMDAR reports allow for better support of both Air Traffic Controllers and Air Traffic Managers. Some of the benefits include more efficient flight planning, prompt rerouting around significant en route weather hazards, etc.
2.5.3. When reliant on radiosonde data only, there is a 12-hour period worldwide between weather balloon launches (though possibly more frequently when severe weather is expected), thus gaps persist between the new information used to update the forecasts. The AMDAR data has allowed for much more frequent adjustments to short term forecasts and more accuracy.
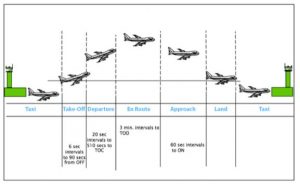
2.5.4. AMDAR is continually transmitting data throughout all phases of flight from take-off through landing. The frequency of these transmissions varies from every one to seven minutes at cruise altitude to every six to twenty seconds near take-off and landing. The data is especially important as it provides frequent updates during critical phases of flight such as climb out and descent. The added positive is the reports give additional information than may be garnered in a typical PIREP (https://journals.ametsoc.org/doi/pdf/10.1175/BAMS-D-14-00055.1).
2.5.5. Prior to the recent addition of Water Vapour Sensing System (WVSS) as part of the AMDAR system information was gathered from already utilized avionics, such as altimeter and wind. There are several issues that could arise in the sensor deployment including, but not limited to: installation costs and procedures, cost of carriage, maintenance and data delivery. A cooperative agreement between airlines and the NMHS incorporates costs and planning. Testing was done in a variety of moisture conditions and showed that sensors agreed very closely with each other. When comparing the sensors with co-located radiosonde data there was less of a bias when utilizing the AMDAR data (https://www.wmo.int/pages/prog/www/OSY/Meetings/NWP5_Sedona2012/2b3_Petersen.pdf).
2.5.6. The sensor package needed to run AMDAR can weigh as little as 4.75 kg and utilizes standard aircraft power. The only component visible outside the aircraft is the external air sensor which is designed to minimize drag. This design prevents ice accumulation, eliminating the need for a heated probe. The goal is to minimize impact to airline operations.
2.5.7. Sensor deployment is managed by airline personnel. Installation takes 40-50 labour hours and is usually done during routine heavy maintenance checks. Once installed some units operate for up to 4 years with no maintenance. When maintenance is deemed necessary it can be done at carrier convenience in coordination with NMHS. It only takes a few hours to swap out units, allowing minimal disruption to service.
2.5.8. While there have been advantages, especially on near term forecasting, the greatest improvements by far have been seen below 300 hPa, or approximately FL300. The advantages there may amount to as much as 3-4x greater than at the upper levels (https://library.wmo.int/pmb_ged/wigos-tr_2014-01_en.pdf).
2.5.9. The software that handles the data can accept data from a variety of equipment, perform high quality checks, perform calculations needed to derive meteorological variables, output messages at set intervals and accept and process inputs allowing users to alter the behaviour. Due to this complex and necessary functionality, it tends to fare best in modern commercial aircraft as they tend to already possess the needed avionics and communications systems.
2.5.10. The AMDAR system performs some quality control on the data as well. If the numbers are outliers, they are excluded from the data set. Data should be sampled, collected and processed in a method compliant with the WMO. This also includes the frequency reporting and the data latency. AMDAR expected value uncertainties are air temperature to +/- .5°C, wind vector to 3 m/s and pressure altitude to 4.0 hPa (https://www.wmo.int/pages/prog/www/GOS/ABO/AMDAR/AMDAR_System.html).
2.5.11. AMDAR quality control also factors in some aircraft type having propensities specific to them. For example, the B737 in one specific model has a bias toward +1.2°K, but it is the only B737 to exhibit such behaviours. Day by day monitoring over a period of at least 10 days will clarify whether it can be deemed a significant bias (https://sites.google.com/a/wmo.int/amdar-news-and-events/newsletters/volume-11-april-2016).
2.5.12. What may appear as only a few tenths of a degree discrepancy on the ground can amount to an error of over a degree by top of climb. There have been studies that detail that there is more of a discrepancy during summer than any other part of the year.
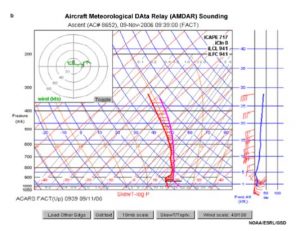
2.5.13. AMDAR sounding images show for a set flight path, the temperature, dew point and winds for the ground through as high as the aircraft fly along the route. Information received can be used to verify forecasts. With many readings over a time frame, trends can be determined. This is frequently utilized in determining the altitudes and locations which will be affected by icing and temperature inversions. A temperature inversion occurs where temperatures warm with height as opposed to cooling with height like they typically do in the troposphere. Temperature inversion altitudes are important in air traffic forecasting because areas of wind shear and turbulence are associated with them. They can also trap moisture below them, leading to clouds. If low enough, that layer of clouds can result in MVFR or IFR. The freezing level can be determined and thus the point where precipitation will change from liquid to solid (or vice versa).
2.5.14. The data can also provide turbulence information. The temperature and wind data can be processed together to get a better image of where the turbulence should be forecast. Typically, there are two methodologies utilized for calculating turbulence data the Vertical Gust and Eddy Dissipation Rate. Some airlines may elect to have the data processed through companies, such as WSI, which provide a user-friendly format.
Benefits and Challenges of AMDAR
2.6. Some challenges include possible lack of data where there is a large seasonal variation in traffic or even on a smaller scale due to airline scheduling. Data can be impacted by microscale and mesoscale phenomena. Data could be interpreted differently. The locations for reports can vary depending on routes (i.e. weather or wind) and landing patterns, creating a void in usable weather observations.
2.6.1. Currently AMDAR is utilized far more in developed countries, leaving a gap in information. Through involving more states a more thorough forecast can be made. Expansion may be especially useful as a cost-effective weather program in more remote areas such as high latitudes, South America and Africa. If airlines and organizations cooperate regionally there is a chance to share the costs of processing the data (https://journals.ametsoc.org/doi/pdf/10.1175/BAMS-D-14-00055.1).
2.6.2. Some may argue that the data is proprietary or want to keep the information exclusive to themselves, but having as much data as possible available helps to create a comprehensive worldwide network. There are a few advantages outside of the forecasting to be had as the NMHS can provide feedback on faulty sensors but also airlines can be seen as providing good customer service and caring for the environment.
2.6.3. When there is a lack of air traffic due to an event, such as the eruption of Eyjafjallajökull in Iceland in 2010 or the attacks of September 11, 2001, gaps in data result. The Iceland volcano eruption led to missing data over the Atlantic and parts of Europe from 14 – 20 April resulting in a near data outage (https://www.wmo.int/pages/prog/www/OSY/Meetings/AMDAR-Panel-13/documents/Doc.3.3.1.4EAMDAR.doc). The critical lack of data led to ICAO to suggest a contingency plan for outages, especially as the data would be critical to forecasting volcanic ash dispersal (https://www.icao.int/safety/meteorology/ivatf/Meeting%20MetaData/IVATF.4.WP.029.2.en.pdf). The terror attacks of September 11, 2001 led to the suspension of all civil traffic and resulted in a loss of AMDAR data. Due to the volcanic activity, there was a 20% loss of wind forecasting abilities and the models’ forecasting ability resulting in a loss of accuracy which lead to a decrease in forecasting accuracy in line with falling back to that of the 12-hour radiosonde error (https://library.wmo.int/pmb_ged/wigos-tr_2014-01_en.pdf).
2.6.4. The approximate cost of outfitting and utilizing 30 aircraft, without use of WVSS2, is only 5-10% of running a traditional radiosonde program over the span of 10 years. Even if the aircraft are equipped with WVSS2 the cost is still only 12-20% of the radiosonde program. Over a 10-year period an aircraft outfitted to provide vertical profiles and humidity sensing average $4-7 or 1-1.5% of a radiosonde profile (https://amdar.noaa.gov/docs/Petersen_presentation.pdf).
2.6.5. There is a great potential for cost savings for airlines as well by allowing better flight route planning and better fuel burn measuring. When fuel burn is more accurately determined, there is less necessity for fuel tinkering, when aircraft carry extra fuel, which saves money in both fuel burn and consumption.
2.6.6. During the first 48 hours, the AMDAR data must stay within agencies involved in operational forecasting and meteorological research. It is not until after 48 hours from AMDAR report generation that the information can be shared with the public; especially not to entities which will use the data to make products for resale.
2.6.7. AMDAR can also be used to provide more accurate weather briefings to be prepared for controllers and traffic managers. Some meteorologists cite the data as important for confirming forecasts as it is for creating future forecasts. These forecasts presented to traffic managers are then utilized to make the best advised routings planning around weather hazards. The controllers may also see this trickle down to them in way of weather reroutes.
2.6.8. One weather model, the HRRR uses the data to give more exact information. As recently as 10 years ago, when forecasters were more dependent on weather balloons, NWS forecasting would use data areas such as 5 or 10 kilometre blocks; now the resolution is down to 3 kilometres. More precise forecasting can allow for more precise traffic management around hazardous weather systems, due to the increase in detailed data.
2.6.9. AMDAR goes beyond just immediate forecast concerns and can supplement climatology forecasting on a local, national and global scale. The analysis of the thermal structures is vital to monitoring and quantifying changes in climate and especially those with specific catalysts such as changes in carbon dioxide concentrations.
2.6.10. Meteorological Data Collection and Reporting Systems (MDCRS) is the US contribution to weather data collection. Many of the major airlines in the US as well as some of the major cargo carriers have been contributing their data.
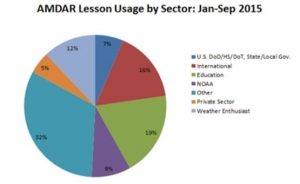
2.6.11. Outside of ATC use there are many ways that the AMDAR can be impactful. There are many stakeholders who may utilize the data including aviation meteorologists, centre meteorologists, airlines and their forecasters, climate scientists and emergency planners (https://journals.ametsoc.org/doi/pdf/10.1175/BAMS-D-14-00055.1).
2.6.12. AMDAR sensors can be used in support of Hybrid Single Particle Lagrangian Integrated Trajectory (HYSPLIT), a weather model which helps to track particulates in the air. The information can be critical in tracking the spread of volcanic ash, nuclear fallout and other hazardous materials incidents. Another example of use is in fire forecasting wherein it is used to confirm forecast data, which is especially vital in the case of fire spreading winds. This model can predict the rate of dispersal and the areas affected. In the United States this can be used in collaboration with local, state and national emergency management such as the Department of Homeland Security.
2.6.13. In-service Aircraft for the Global Observing System (IAGOS) has established a program to distribute the infrastructure for measuring additional trace gases. Utilizing AMDAR data would allow for the long term measuring of compounds like oxygen, methane, reactive nitrogen compounds as well as particulate matter and cloud droplet backscatter (https://library.wmo.int/pmb_ged/wigos-tr_2014-01_en.pdf).
Concrete Examples of AMDAR Use
2.7. Around the world there are different aspects to the AMDAR data that are most commonly utilized. New Zealand receives relatively little upper wind information so the addition of the AMDAR data is critical to forecasting. One example is when reports of severe turbulence were received forecasters were able check AMDAR reports to see that the shear was associated with an upper air trough that had a sharper change in winds than expected. Some New Zealand forecasters cited LLWS and turbulence as the most used aspects of AMDAR. AMDAR provides critical wind data over marine areas where there would be a lack of reporting systems which is vital for fact checking wind and turbulence SIGMETs.
2.7.1. In Sweden forecasters utilize the AMDAR data as a compliment to sounding data for wind readouts and freezing levels. The forecasters indicate further advantages included more frequency of reports over a wider geographic expanse. One negative is a lack of humidity information at Swedish airports.
2.7.2. Finnish forecasters say the information can be hard to apply and have a hard time citing where it has been a specific advantage. One notable positive is the increased accuracy of wind and approach forecasting near Helsinki. The biggest issue in Finland is that there is only one primary airport which is in the far south of the country and there is otherwise a lack of reports, thus not generating a full picture.
2.7.3. AMDAR data is vital to forecasting along the west coast of the United States where there are frequently low ceilings and fog that can greatly impact traffic flow. The National Weather Service (NWS) in San Diego purport to be one of the biggest users of AMDAR data in the United States. The data helps forecasters monitor the marine layer and fog. The San Diego NWS office is responsible for issuing several Terminal Area Forecasts (TAFs). In one specific instance the forecast weather was 2 miles’ visibility with clear sky along with no impact from temperature inversion. The meteorologist noted that as AMDAR reports came in it showed that the marine layer had crept into the valley and there was potential for fog and low level clouds, thus a significantly decreased arrival rate.
2.7.4. One example of implementation roll out is from a Tropospheric Airborne Meteorological Data Report (TAMDAR), a specific type of AMDAR. In 2004 Great Lakes Airlines installed the equipment across over 60 aircraft in its fleet based in the central United States. The forecasters at the National Weather Service promptly noted improved numerical forecast accuracy, specifically an increase of 20% in temperature accuracy and 10% for wind and 12% in relative humidity for 3 hour forecasts. The goal of the TAMDAR trials was to help future pilots to be able to have better weather information to make more informed decisions (https://www.nasa.gov/vision/earth/environment/2006ams_TAMDAR.html).
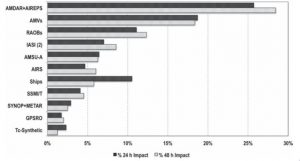
2.7.5. In fall of 2014 a major hurricane, Hurricane Sandy was headed to make landfall in New York. AMDAR data is credited as having the greatest impact of any resource on forecasting the time and place of landfall. Below is a chart conveying the impact of AMDAR on the event.
2.7.6. An example of utilizing AMDAR data directly affecting a flight occurred in February 1998. An aircraft flying from Italy to Miami had fuelled in Italy. The pilot had not taken into full account the head winds while fuelling, leading to a potential fuel exhaustion situation. AMDAR data was used to determine a lower head wind altitude by using reports over the Bahamas, which indicated up to 40 knots lower head winds than the flight in question was reporting. Controllers used this information to change both the airliner’s altitude and route to best preserve remaining fuel.
Conclusions
3.1. AMDAR provides a cost-effective weather reporting system with increased accuracy from the radiosonde programs. Utilizing AMDAR weather reports received from the airframe are more comprehensive and far more frequent, especially during critical phases of flight.
3.2. The data received by AMDAR contributes to many facets of meteorology. It is used by forecasters for air traffic to provide timely and accurate routing, turbulence, icing and more. The data can be applied to dispatchers to provide pilots updated information. Further reaching emergency managers can use the upper level winds to help avert problems and climate meteorologists have a more in depth web to probe for comparisons.
3.3 AMDAR data provides a more comprehensive worldwide weather picture. When airlines and meteorological groups team up there is more opportunity for a more robust weather forecast. There is concern over future proprietary data leaving some in the dark.
Recommendations
4.1 It is recommended that:
IFATCA encourages collaboration in gathering aircraft-derived meteorological data to form a globally comprehensive picture.
is included in AAS 1.16 in the IFATCA Technical and Professional Manual.


